Optimization
Code optimization is a field of study that aims to improve some
aspect of the code, be that speed of operation, memory usage or
program size. Here I will be focusing on increasing the runtime
performance of the interpreter. The short term goal will be to
look at the performance of
speed_test.bf and then expand into a series of more complex
programs to expand the diversity of optimizations needed. The
main intent here is to understand for myself some of the many
optimizations a compiler can make on a simple programing language.
Of course a compiler can only do so much, when writing code using
sensible data structures and algorithms can remove large portions
of work increasing runtime performance. Of course increasing
runtime performance for the sake of it can lead to code that is
more complex than it needs to be, so be sensible profile your
code and see if it is even worth the developer hours to push for
that 50% reduction in execution time when the end user is already
running a pipeline that is 30x slower than your component. However,
we are not here to be sensible we are here to learn so for those
interested in genreal
optimization techniques in C++ please visit the resources
compiled by Agner Fog.
Measurement and Profiling
Profiling is a form of analysis that measures the frequency and
duration of operations called from software. This can be
achieved in a number of ways, I have chosen to add instrumentation
to the BF Interpreter so that it can record which operations are
run and how many times. The main issue with instrumentation of
code comes with adding in extra instructions.
Instrumentation works by adding extra instructions somewhere in
the code, that can be in the source code, the assembely code or
by using hardware intterupts. Either way the cpu is doing extra
work to identify when something needs to be recorded. This extra
work can ruin the estimated time spent running a particular section
of code and make trying to increase runtime performance hard.
Some work arounds involve only instrumenting part of the code or doing
a statisctical analysis of the instrumentation to try reduce the
effect the profiling tools have on the measurement. There have even
been interesting work in
causal profiling
which trys to negate some of these side effects by understanding
how various sections of the code contribute to the total runtime.
I have implemented 2 different profiling tools into the BF Interpreter.
The first is a FULL profiler, it directly counts every single
operation and which index in the instructions list it comes from.
The second is a LOOP only profiler, this only counts the open and
close instructions in the loop and fills in the rest of the profile
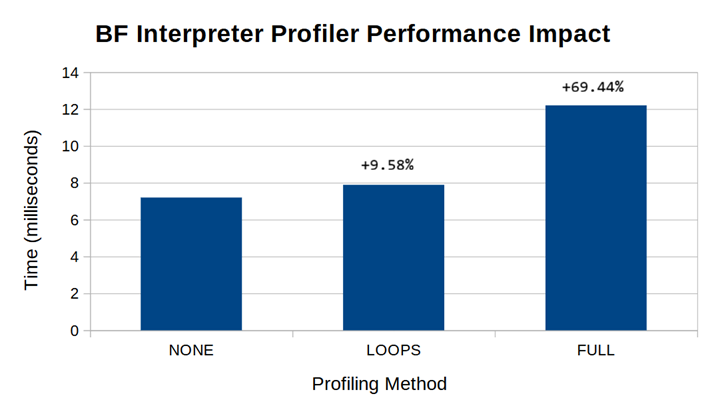
information after the cpu has completed executing. The following
graph shows how much of an effect this can have on run time performance
when the interpreter runs the speed-test.bf program with the following
settings: 8bit cpu, 1k mem, RLE and Clear Loop optimizations. The
fastest of 25 measurements is shown here. Interestingly this is
dependent on the program which is run as the instrumentation can
only log events for things which happen, for example if a loop is skipped
no information on how long that loop could take is measured.
It should be noted that even with this profiling information time is very
difficult to measure, this is due to the operating system doing
other operations and taking control of the processor whilst the
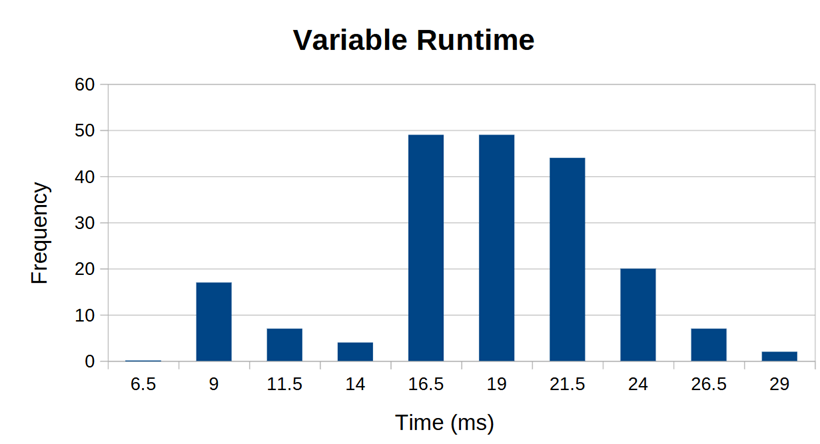
interpreter is running. This can lead to wildly fluctuating
execution times. It is always best to take multiple readings and
get a feel for how long something actually takes to run. This
can be seen in the histogram below, which shows the variability of the
same speed-test.bf program run 200 times with no profiling.